Cache latency and hit rate
With the load generator successfully run for the second time (now with caching enabled), it’s time to take another look at the time our APIs are spending reading data. You can load the dashboard by navigating to CloudWatch via the AWS console and clicking on the MomentoPizza dashboard. You can also jump directly to it here.
As a refresher, here is what the dashboard is able to show us…
- Time spent looking in the cache for data (now enabled)
- Time spent requesting data from the database when there is a cache miss
- Cache hit rate (now enabled)
You’ll now see metrics present for additional information relating to caching. The hit rate is shown for the caching of each API endpoint along with cache read latency (average and p99).
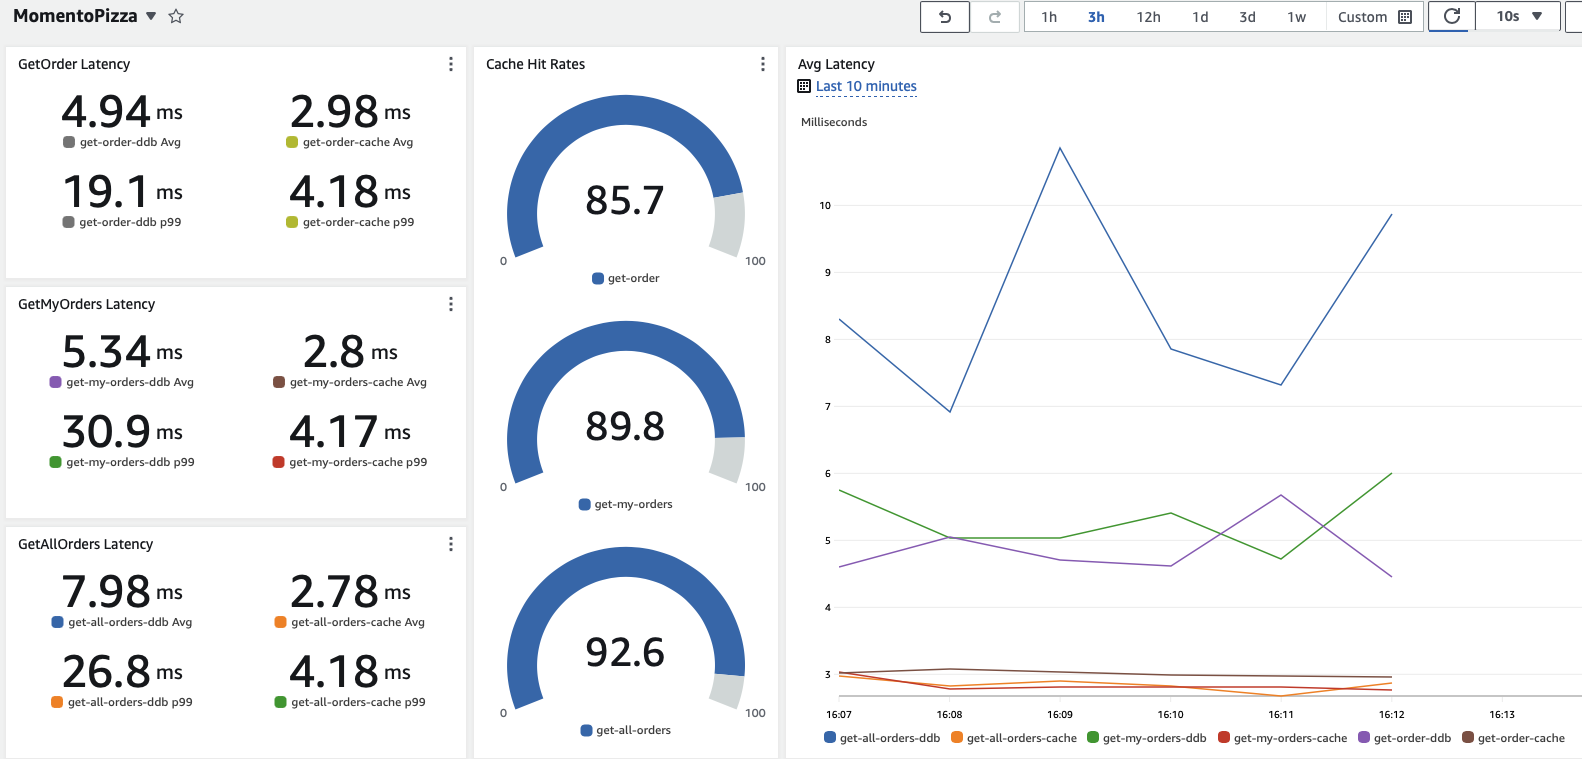
Things to observe and ponder
Referring back to the results you recorded from the earlier (non-cached) test run, consider how things have (or have not) changed:
- The latency numbers for the calls to DynamoDB should remain around the same for both average and p99.
- The latency for cache reads should be significantly improved versus the DynamoDB reads (especially at p99).
- We are now see some cache hits - and the rate of cache hits seems pretty good - almost 90%. But for one of the APIs, we’re only getting that nice cache latency around 85% of the time. Wouldn’t we want the high rate to be higher for this if possible?
We can do better - let’s get back to work.