Start load generator
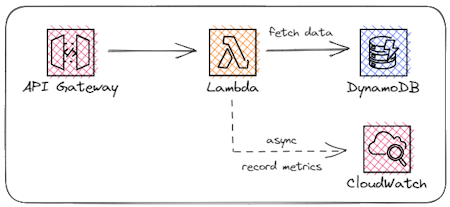
Our workshop will be introducing a cache into the Momento Pizza API. But before we do that, we need to get a set of baseline numbers. We want to see how quickly our GET endpoints are performing by simply using DynamoDB. All endpoints in both the Admin API and Order API follow a very simple architecture.
To generate load on the system, we need to create pizza orders, load them individually, and load lists of pizzas. We can do this by running the Load Generator State Machine we deployed into our AWS account.
How The Load Generator Works
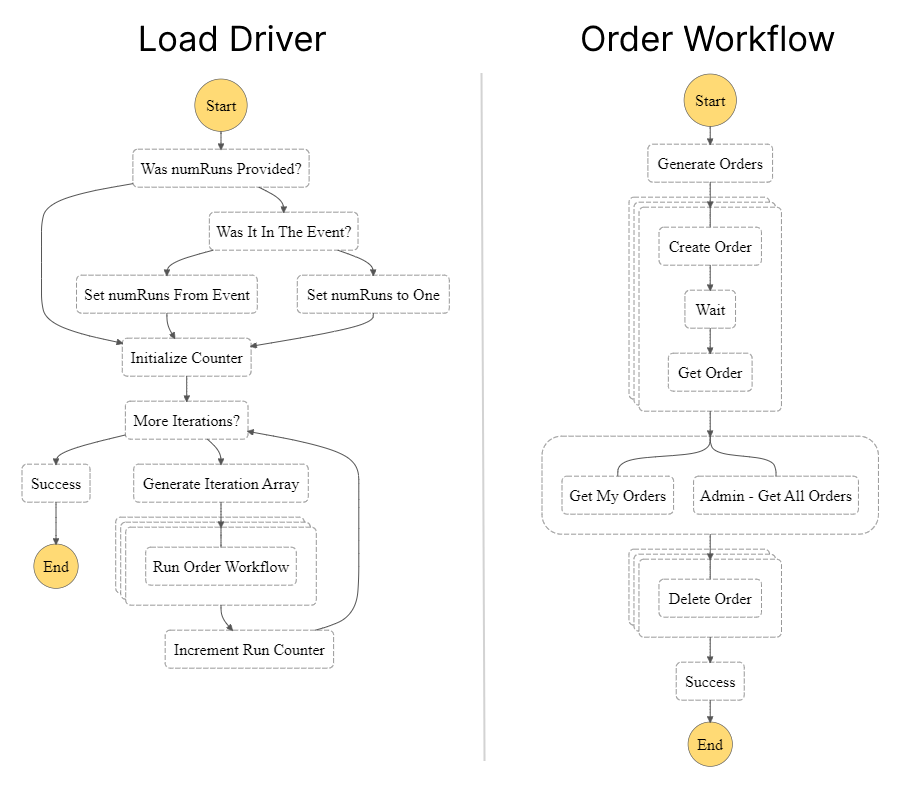
The load generator will run for around 10 minutes, generating orders with various amounts of pizzas and toppings. It will submit the order, and soon after fetch it a number of times. It will also fetch lists of orders for a particular customer and the list of all orders which need to be fulfilled. And finally it deletes all the data it created. The load run will stop by itself when complete - no need to shut anything down.
This process will send metrics into CloudWatch for you to monitor response latencies. Once the load generation has begun, please allow a couple of minutes for the metrics to be visible in the Momento Pizza Dashboard. The load generator will run for around 10minutes, and will then stop.
Starting the Load Generator
You can start the load generator in one of two ways, depending on your personal preferences. Both ways result in the same outcome.
Via the CLI
The load generator is configured to start in response to an EventBridge event. To trigger it via the command line, you can use the command below in the root of the /api directory.
aws events put-events --cli-input-json file://json/generator.json
Tip - If you’re using a named AWS profile for your deployments, you must also use it here. Just add the --profile <profile name> flag to the end of the command
Via the AWS Console
To start the load generator via the AWS Console with point and click steps, first sign in to AWS and navigate to the Step Functions dashboard.
- Click on the state machine in the dashboard that has a name starting with
GeneratorStateMachine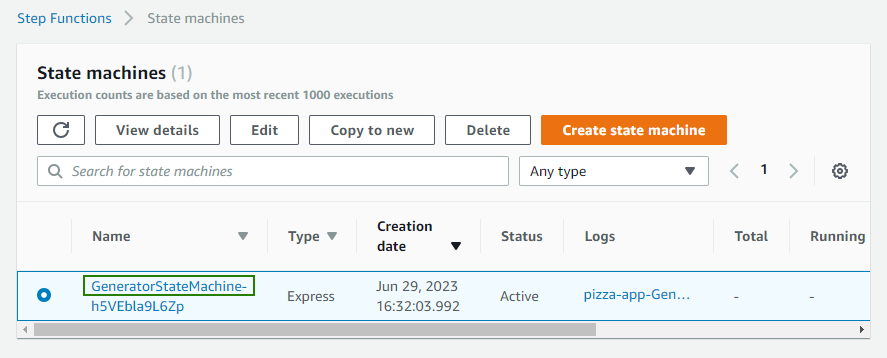
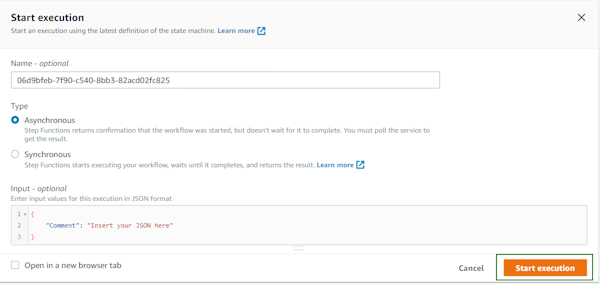
- On the state machine detail page, click the New execution button in the upper-right corner
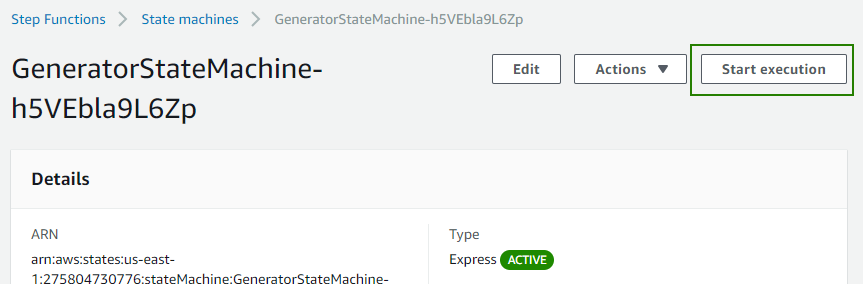
- Once the popup appears, click on the Start execution button in the lower-right corner. You do not need to change any input information
Both of the above methods result in the generator running. Once you kick it off, give it a couple of minutes before heading to the CloudWatch dashboard - the metrics will take a few minutes to appear.