Assess original latency
With the load generator successfully run, it’s time to take a look at the time our APIs are spending reading from the database. You can load the dashboard by navigating to CloudWatch via the AWS console and clicking on the MomentoPizza dashboard. You can also jump directly to it here.
The Momento Pizza Dashboard
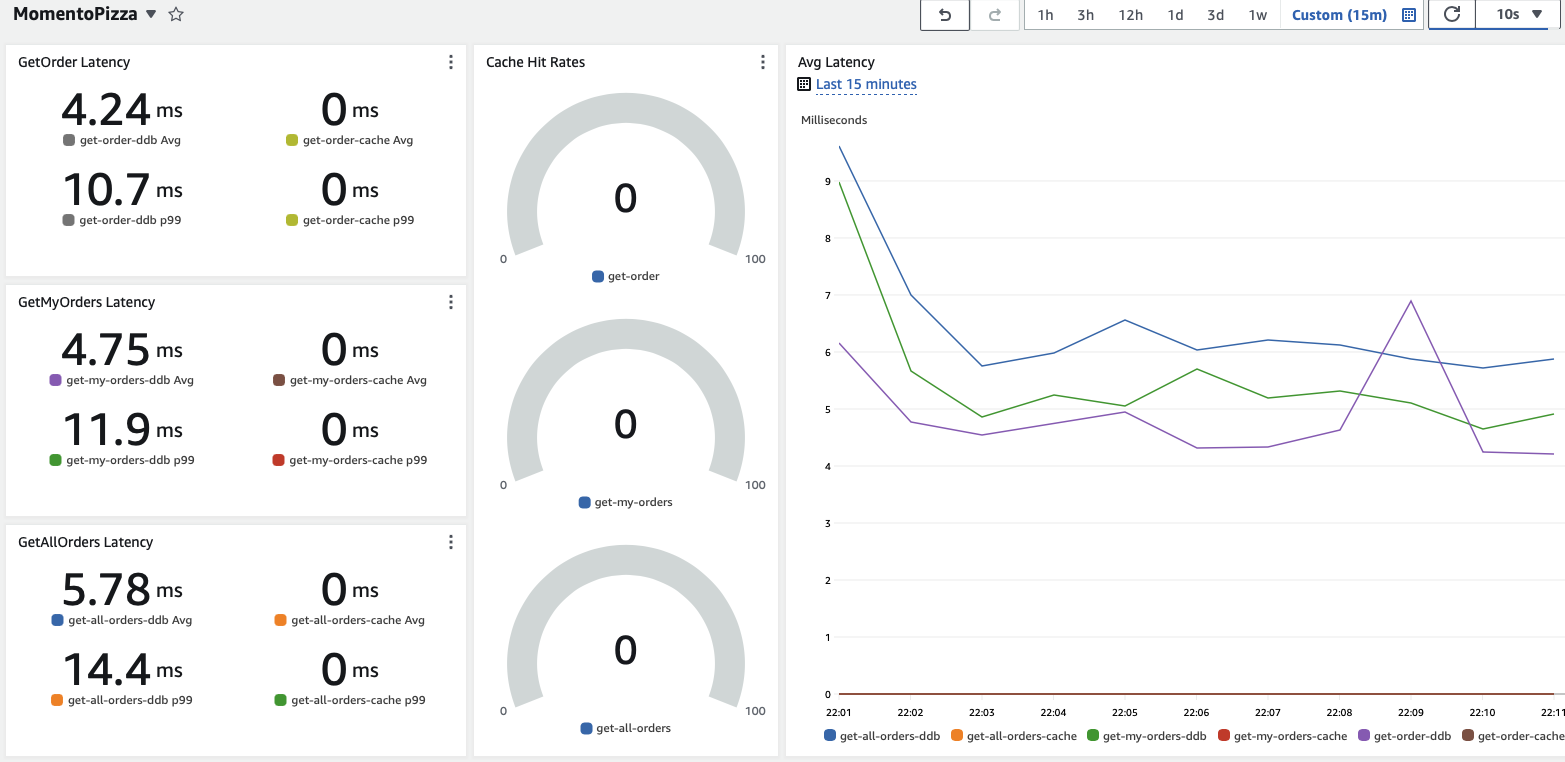
The metrics for this workshop are broken out into three parts (for each of our 3 read APIs undergoing performance testing):
- Time spent looking in the cache for data (not yet enabled)
- Time spent requesting data from the database
- Cache hit rate (if enabled)
Don’t worry about the caching-related metrics yet - they’ll make more sense later.
At right you’ll see a line graph depicting these metrics as an average - the most recent 10 minutes of metrics are shown.
At left, you’ll see latencies in milliseconds for each of our 3 API endpoints, at both average and the 99th percentile (p99).
Admin API
- GET /orders (Get all active orders)
- GET /order/{id} (Get order by id)
Order API
- GET /orders (Get all orders the caller created)
Tasks
We will be coming back to this dashboard several times over the course of the workshop. With this in mind, perform the following tasks:
- Observe the graph - do the results stay flat throughout? Or do things need to “warm up” and settle? Do your observations match what you’d expect?
- The (5 minute) averages should look pretty good - DynamoDB is a fast database. It is also quite consistently fast - but are you surprised by how much higher the p99 latencies are beyond the average? If you’re the user encountering that p99 request as you’re tracking your pizza order, will the latency make the site seem slow?
- Write down (or screenshot) the average and p99 latencies from the metric-based widgets on the right half of the dashboard - we’ll refer back to this later for comparison.
That’s it for now! Time to work some caching in with our code 🤓